We revolutionize electrical distribution grids with state-of-the-art technology.
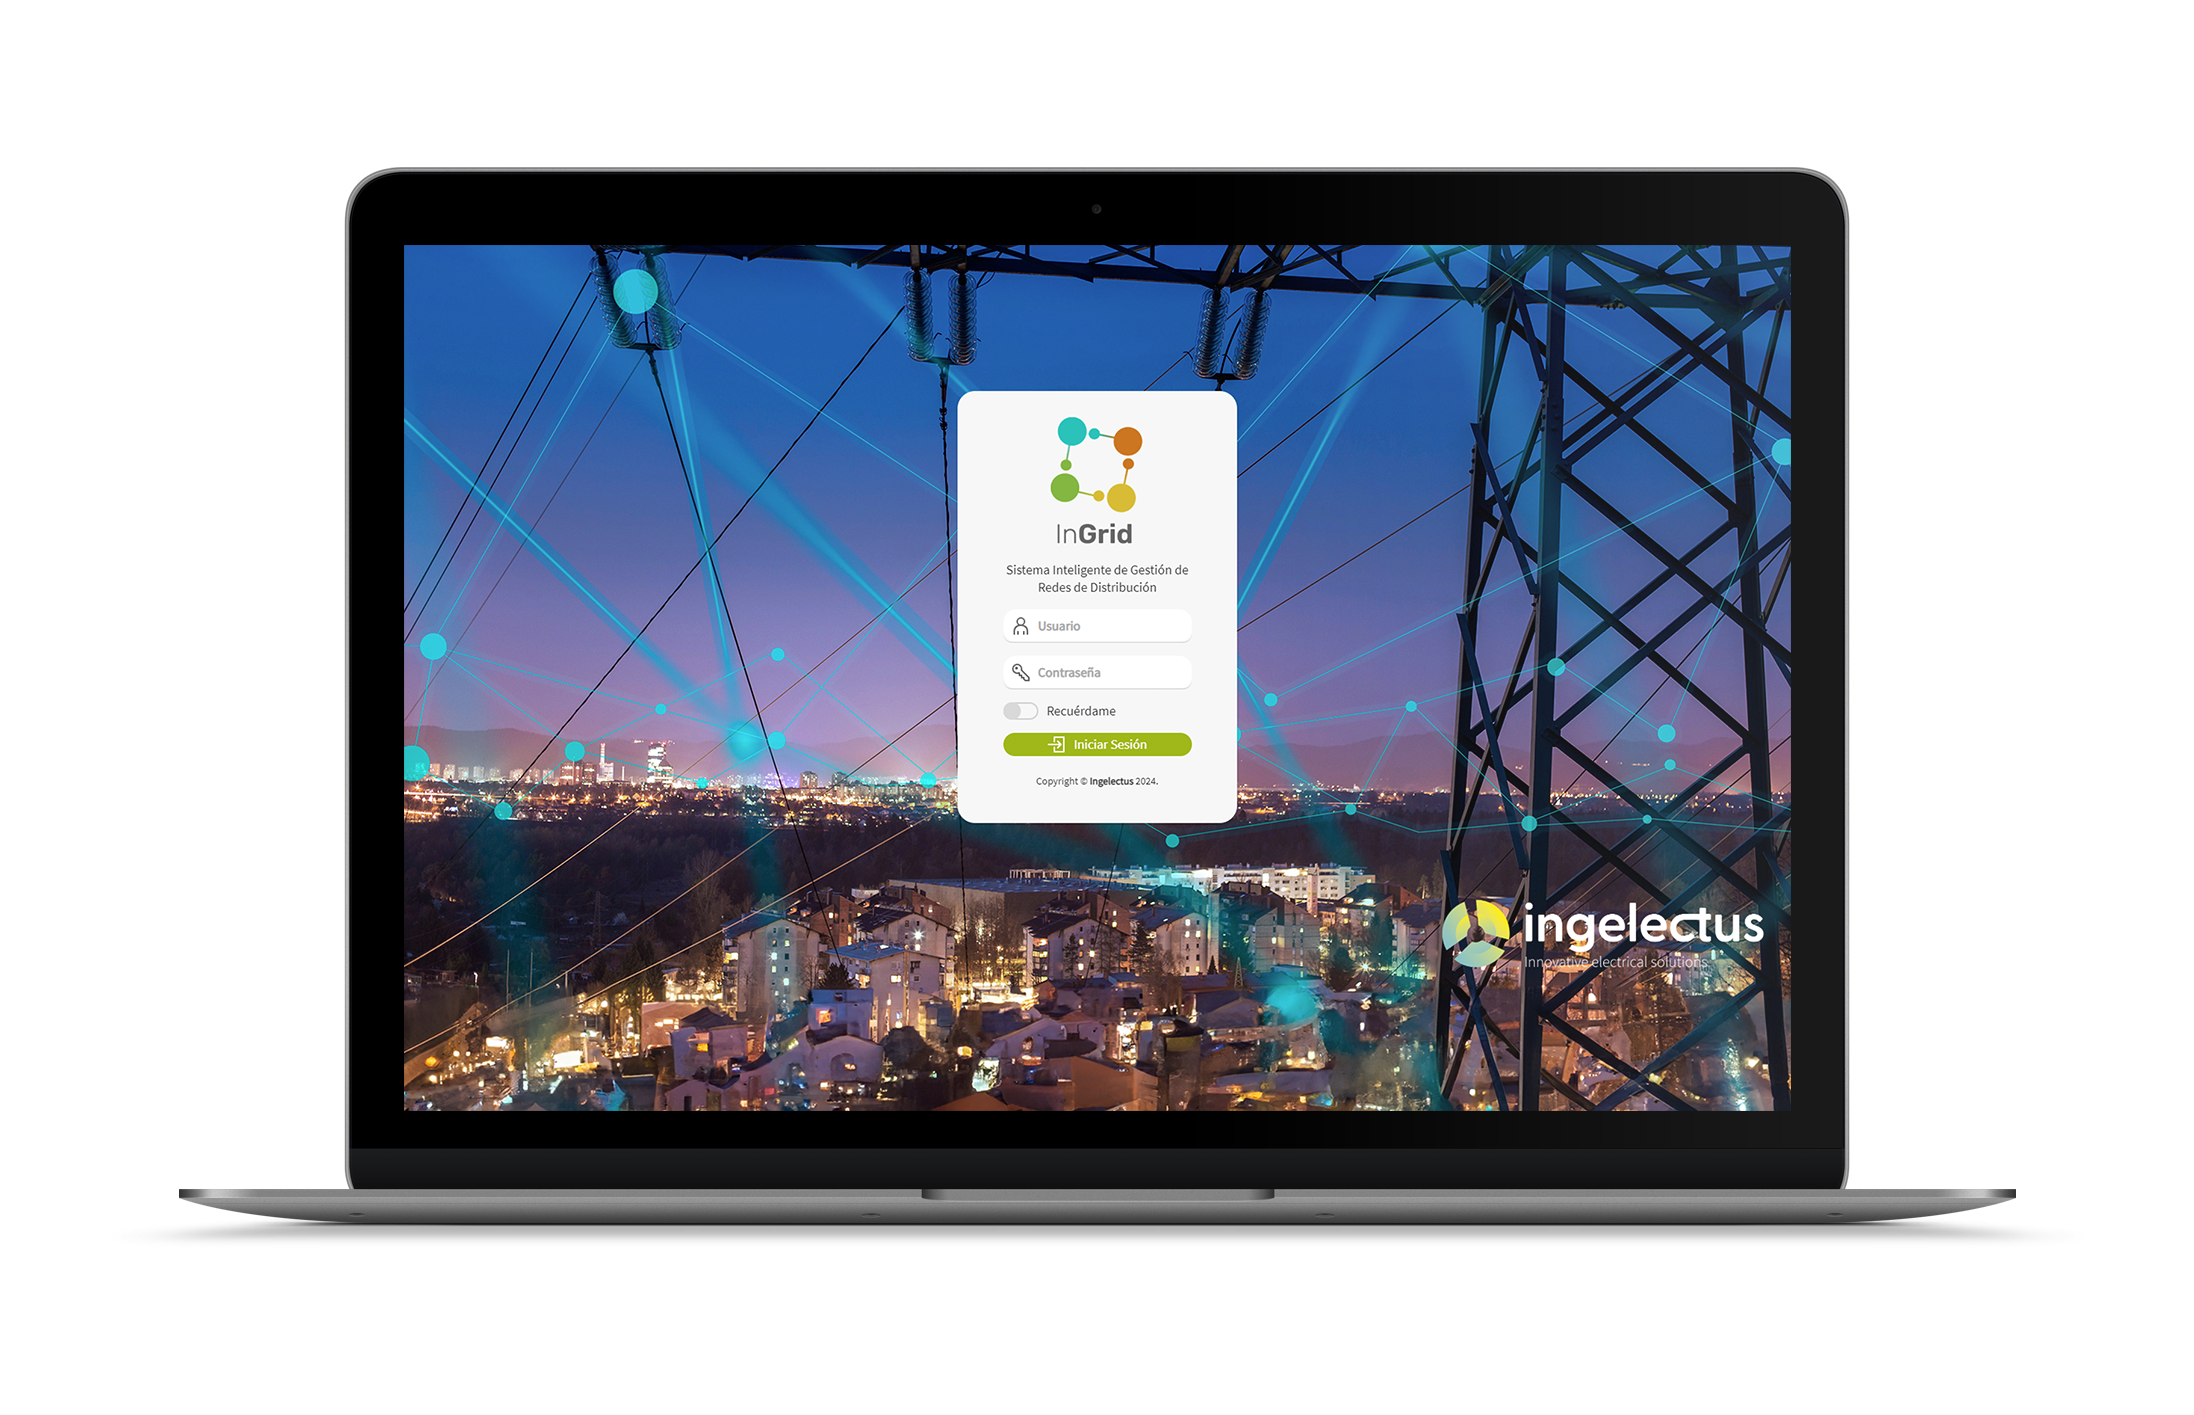
InGrid is a suite of applications that enable monitoring, diagnosis and operation across smart grids. These applications have been designed to support decision making and planning, risk assessment, grid investment orientation and the planning of optimal grid operation strategies. Ingrid therefore represents a paradigm shift in the management and operation of electricity distribution networks. The operator’s experience, the real knowledge of the network, free of interpretation, and the use of technology, guarantee an optimized operation.
SUITE OF APPLICATIONS
EVERYTHING YOU NEED IN ONE SUITE
SUITE OF APPLICATIONS
EVERYTHING YOU NEED IN ONE SUITE

Managing your network as you have never experienced it before
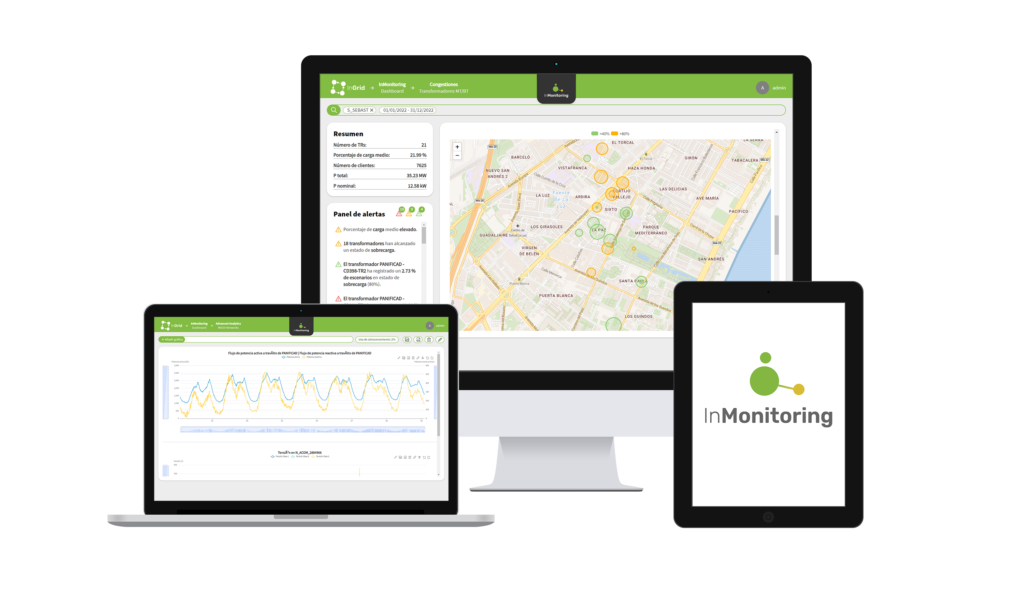
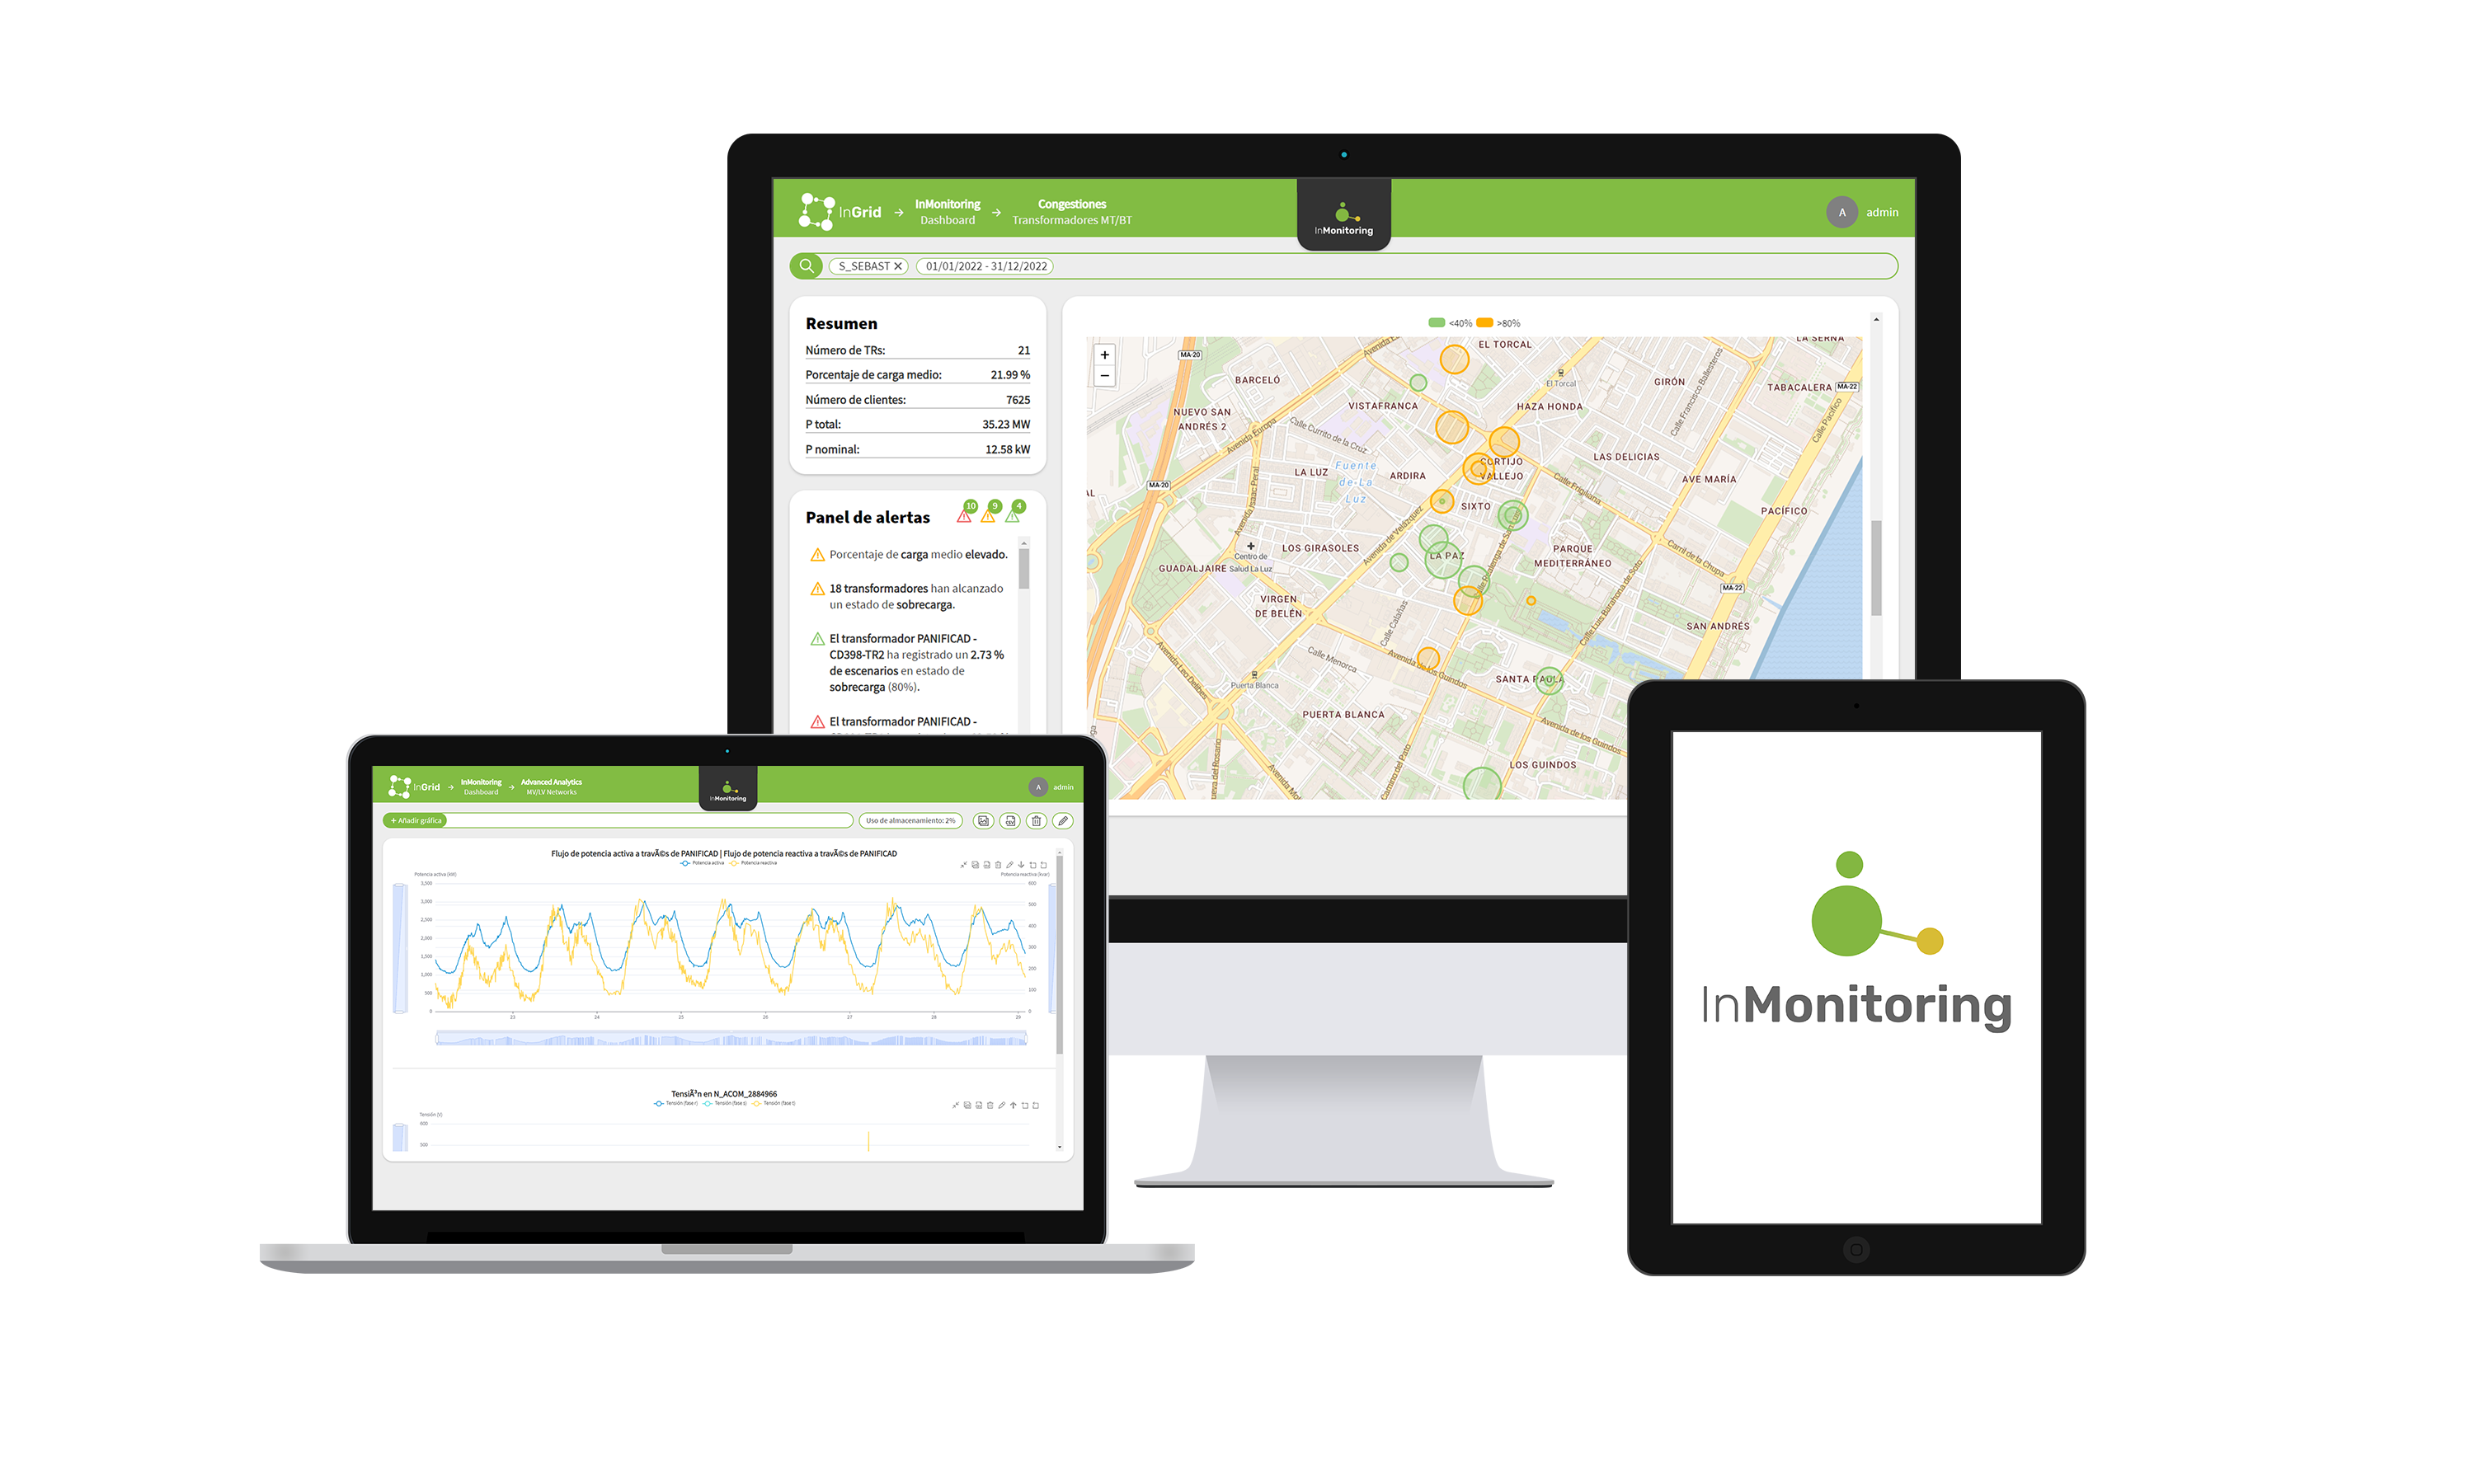
InMonitoring calculates and reports the operating state of the network with Distribution System State Estimation algorithms to identify congested areas, generate insights on the behaviour of the distribution networks and give access to the historical electrical status of each node and each network section. Adapted for Medium Voltage, Low Voltage and intelligent Power Transformers.
This knowledge is visually displayed through dashboards that centralise the KPIs that the DSO needs to know what is happening in its network focusing on: Congestions, Supply Quality, Technical Losses or Imbalances.
- Distribution System State Estimation (DSSE).
- Adapted to balanced and unbalanced networks.
- Extends the knowledge of the network to its full extension.
- Integrable with SCADA, AMI and GIS systems.
- Deployable in any Cloud and Edge environment.
Use Cases:
- Identification of areas of Low Voltage areas with recurrent supply quality problems.
- Location of network sections and phases with load congestion to guide investments in network reinforcement or the need for load balancing.
- Locate areas with network flexibility needs and assess the possibility of creating local flexibility markets.
- Decision support for network planning tasks such as seasonal tap changes in transformers or fuse size optimization.

Managing your network as you've never seen it before
InMonitoring calculates and reports the operating state of the network with Distribution System State Estimation algorithms to identify congested areas, generate insights on the behaviour of the distribution networks and give access to the historical electrical status of each node and each network section. Adapted for Medium Voltage, Low Voltage and intelligent Power Transformers.
This knowledge is visually displayed through dashboards that centralise the KPIs that the DSO needs to know what is happening in its network focusing on: Congestions, Supply Quality, Technical Losses or Imbalances.
- Distribution System State Estimation (DSSE).
- Adapted to balanced and unbalanced networks.
- Extends the knowledge of the network to its full extension.
- Integrable with SCADA systems and ADMS.
- Deployable in any Cloud and Edge environment.
Use Cases:
- Identification of areas of Low Voltage areas with recurrent supply quality problems.
- Location of network sections and phases with load congestion to guide investments in network reinforcement or the need for load balancing.
- Locate areas with network flexibility needs and assess the possibility of creating local flexibility markets.
- Decision support for network planning tasks such as seasonal tap changes in transformers or fuse size optimization.

Shifting the paradigm of distribution network management
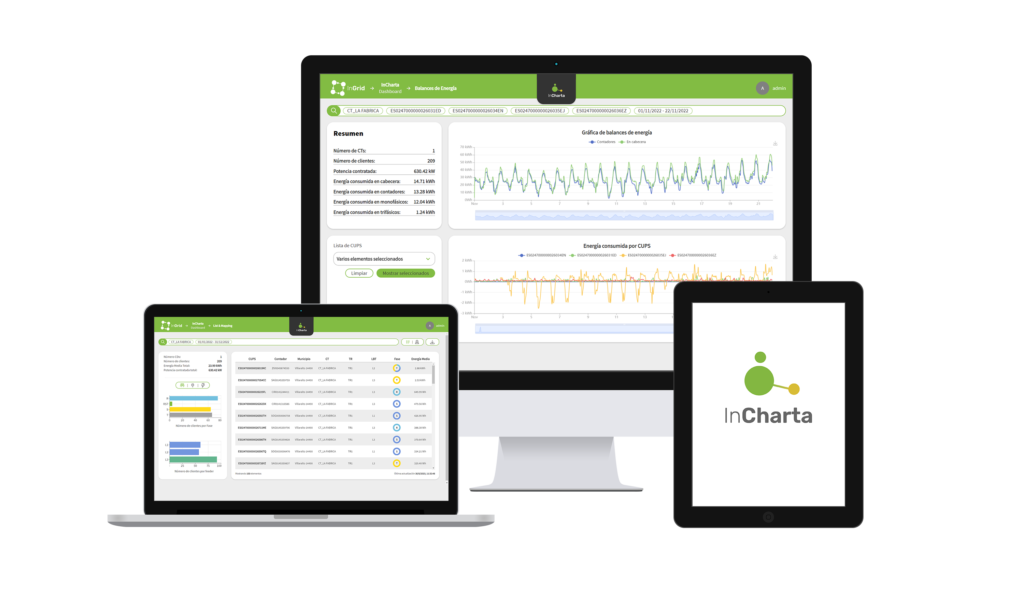
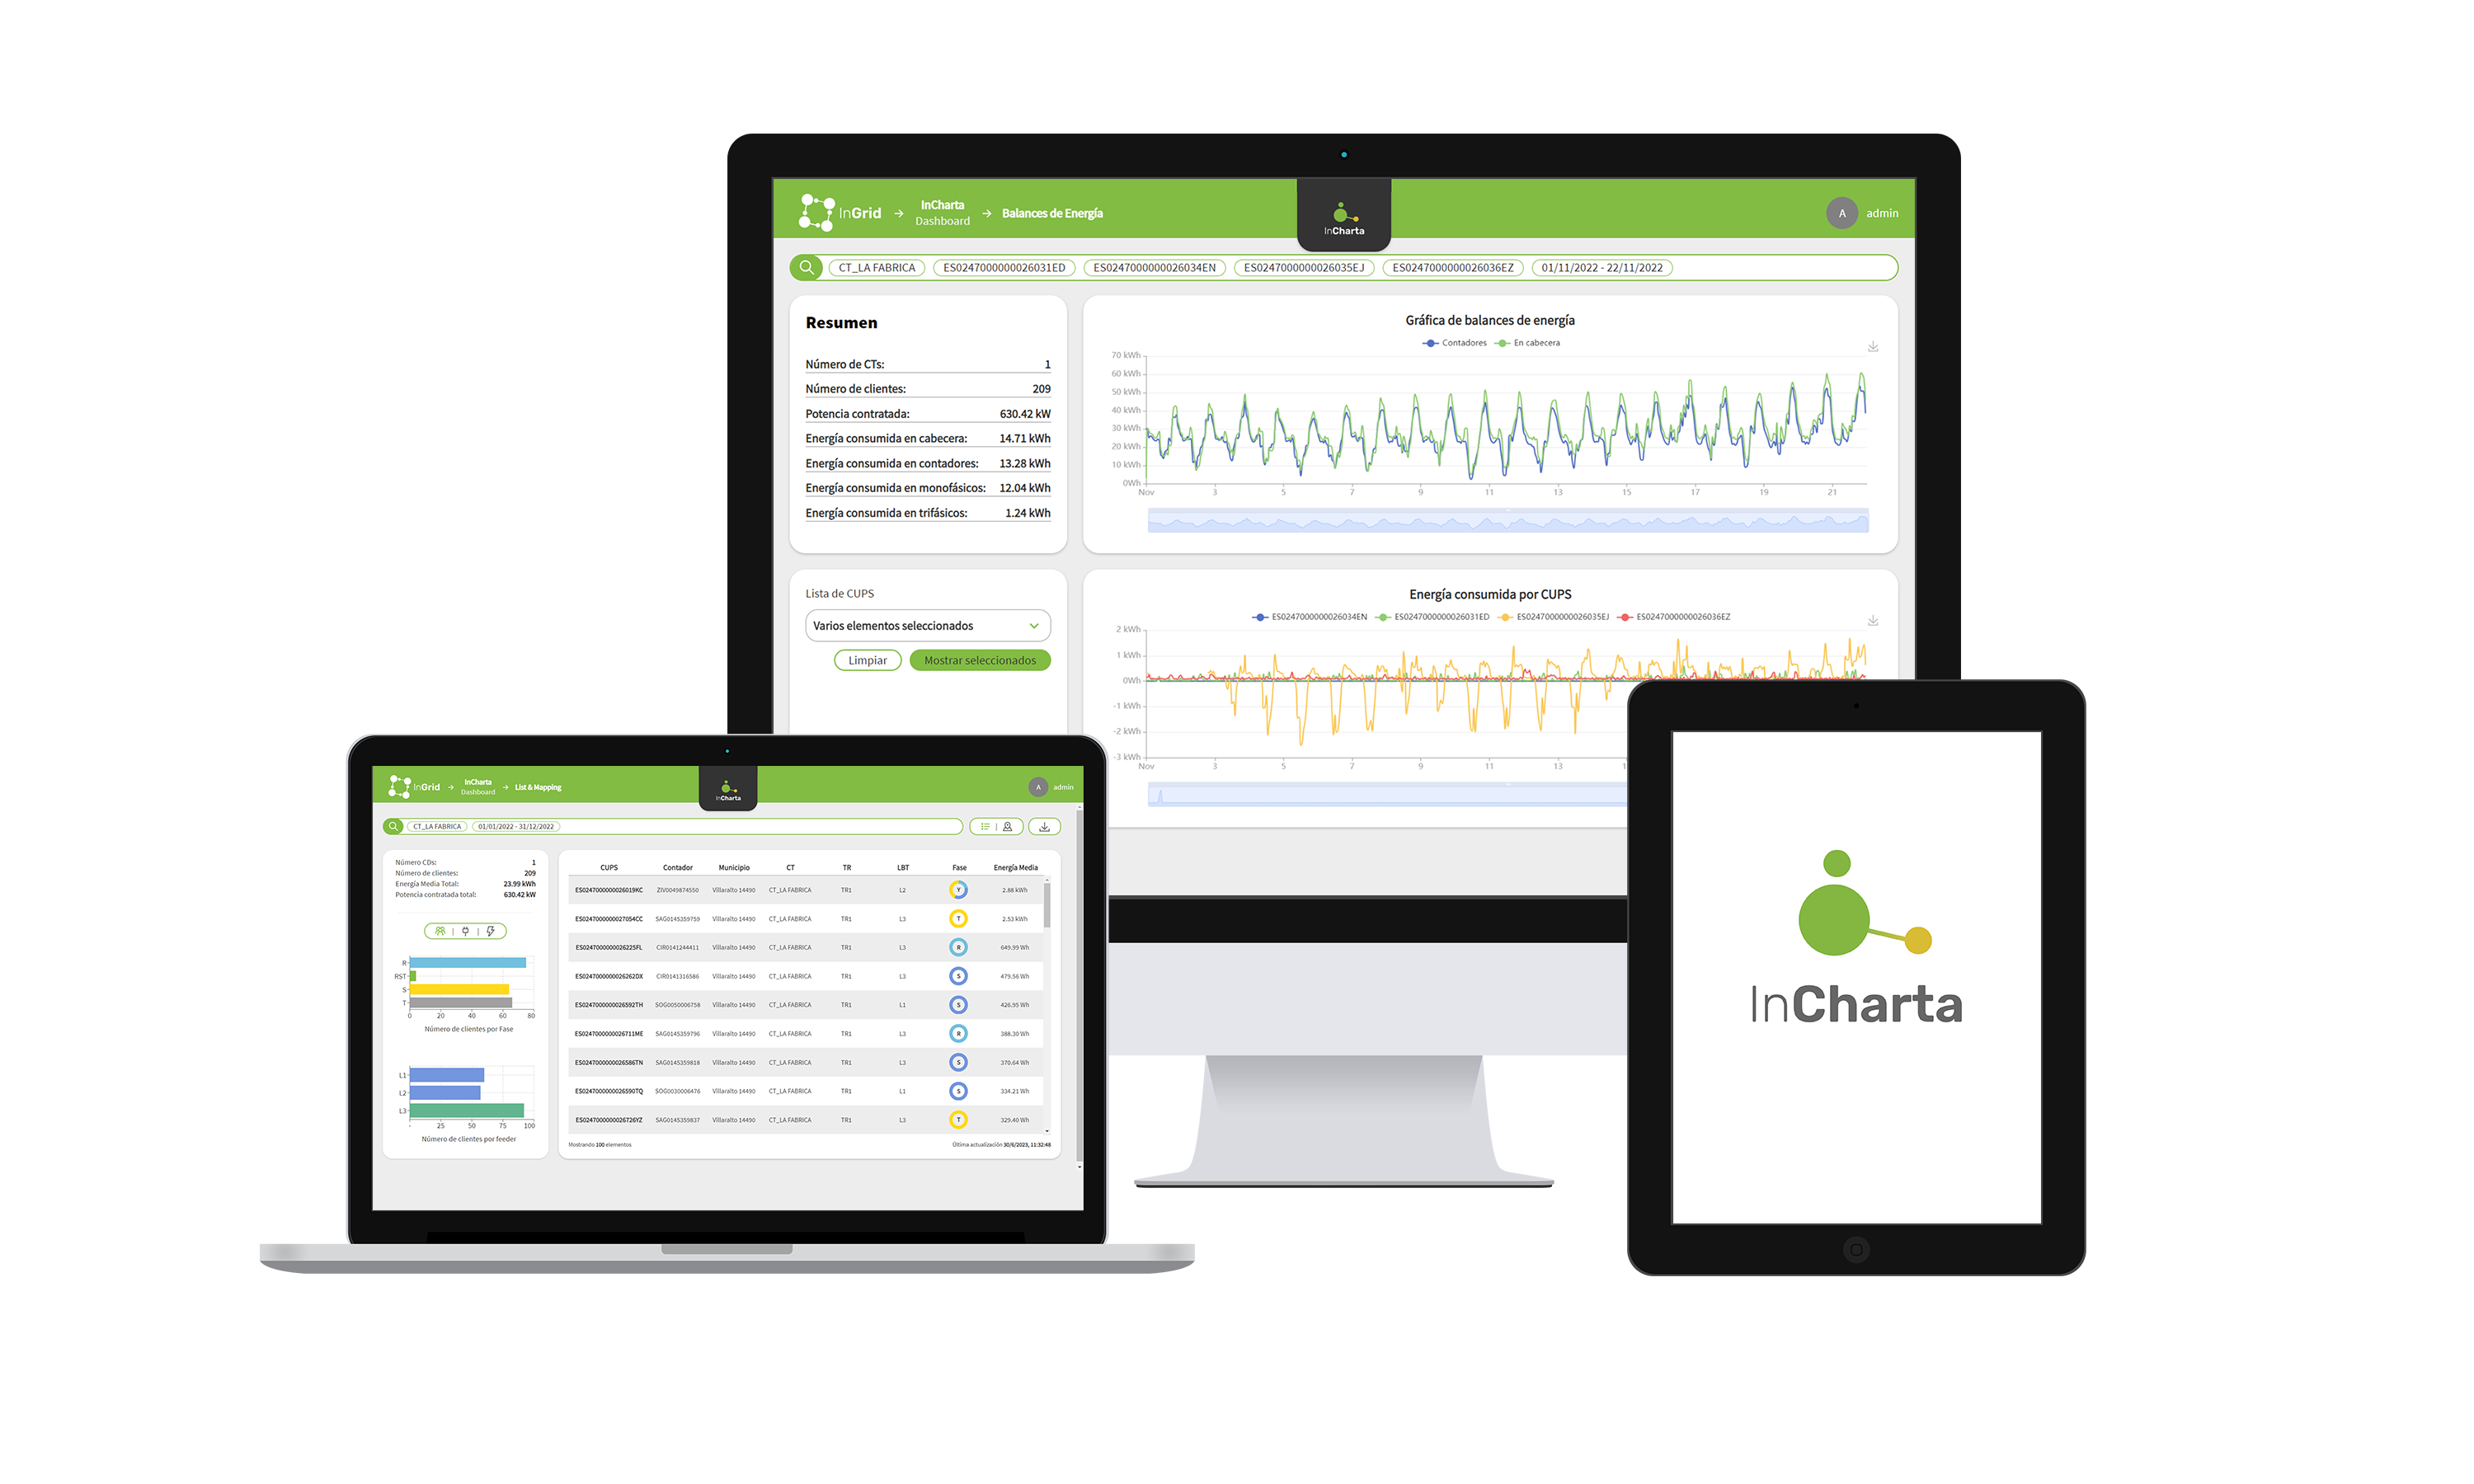
InCharta is an Artificial Intelligence based application for network topology discovery and identification of global losses in Low Voltage. It allows correcting and extending inventory information, calculating energy balances and analyzing and locating network losses in order to prioritise field work for fraud identification or grid planning. This knowledge is calculated periodically by identifying topological changes, new connections and scenarios with losses. The application is divided into three tools:
- List&Mapping: customer-phase and customer-feeder association.
- Energy balances: interactive tool to perform energy balances.
- Losses Control Center.
- Based on hourly-load-curves of supplies and Supervisors energy measurements.
- Calculates the distribution of consumption in three-phase supplies per each phase.
- Periodic update of the status of supply connections.
- Linking new connections, abnormal clients and network.
- It is independent of the meters firmware and the communications standard.
- Adapted to LV networks with significant losses.
Use Cases:
- Correction and expansion of DSO inventory information.
- Quick access to the topological information of the entire low voltage network in table and map form.
- Location and isolation of areas with significant low voltage losses.
- Automatic generation of network loss reports.
- Analysis of loss patterns and contrast with the behaviour of network users.
- Analysis of the evolution of losses through the interactive calculation of energy balances in transformers, low voltage lines and phase schedules.

Shifting the paradigm of distribution
network management
InCharta is an Artificial Intelligence based application for network topology discovery and identification of global losses in Low Voltage. It allows correcting and extending inventory information, calculating energy balances and analyzing and locating network losses in order to prioritise field work for fraud identification or grid planning. This knowledge is calculated periodically by identifying topological changes, new connections and scenarios with losses. The application is divided into three tools:
- List&Mapping: customer-phase and customer-feeder association.
- Energy balances: interactive tool to perform energy balances.
- Losses Control Center.
- Based on hourly-load-curves of supplies and Supervisors energy measurements.
- Calculates the distribution of consumption in three-phase supplies per each phase.
- Periodic update of the status of supply connections.
- Linking new connections, abnormal clients and network.
- It is independent of the meters firmware and the communications standard.
- Adapted to LV networks with significant losses.
Use Cases:
- Correction and expansion of DSO inventory information.
- Quick access to the topological information of the entire low voltage network in table and map form.
- Location and isolation of areas with significant low voltage losses.
- Automatic generation of network loss reports.
- Analysis of loss patterns and contrast with the behaviour of network users.
- Analysis of the evolution of losses through the interactive calculation of energy balances in transformers, low voltage lines and phase schedules.

We monetize the potential of your electrical network
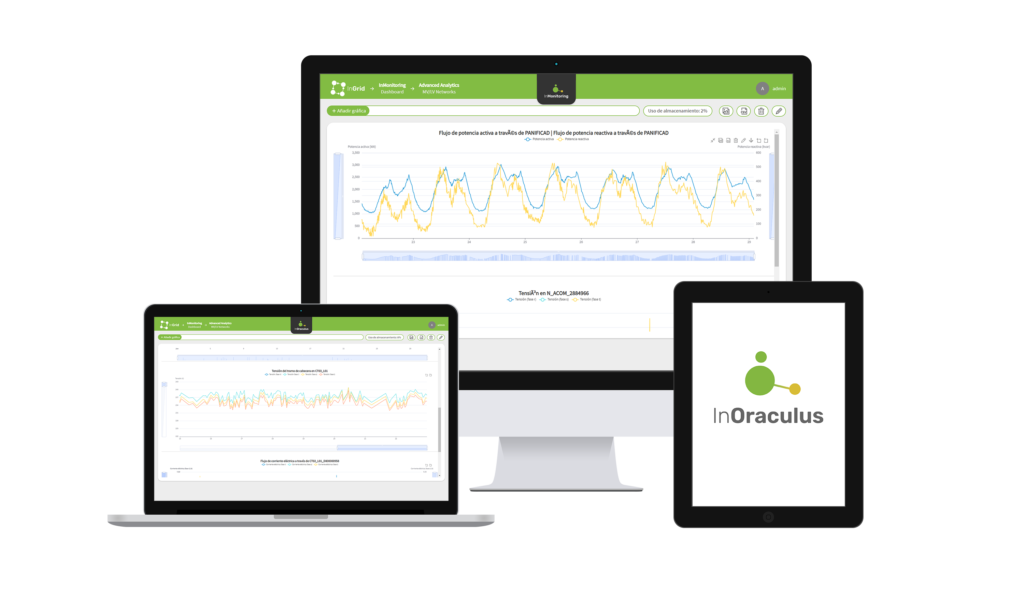
InOraculus is a demand and generation forecasting system both at the supply point level and at the aggregate level of low voltage feeder, transformer station or primary substation. The cutting-edge technology behind InOraculus uses Artificial Intelligence to train machine learning models and neural networks to generate short- and medium-term future forecasts.
- It uses the information available from the DSO in the AMI and SCADAs.
- Generates energy and quarter-hourly power forecasts at the supply point level.
- Generates voltage, power and energy forecasts at the Secondary Substation level.
- Based on artificial intelligence, machine learning models, neural networks and data science.
- Deployment in any Cloud and Edge environment.
Use Cases:
- Network planning based on accurate forecasts of user demand and generation in the short and medium term.
- Filling of information gaps in hourly-load-curves and instantaneous values resulting from device communication problems.
- Preventive maintenance of electrical networks.
- Designing network operation strategies in advance

We monetize the potential of your
electricity network.
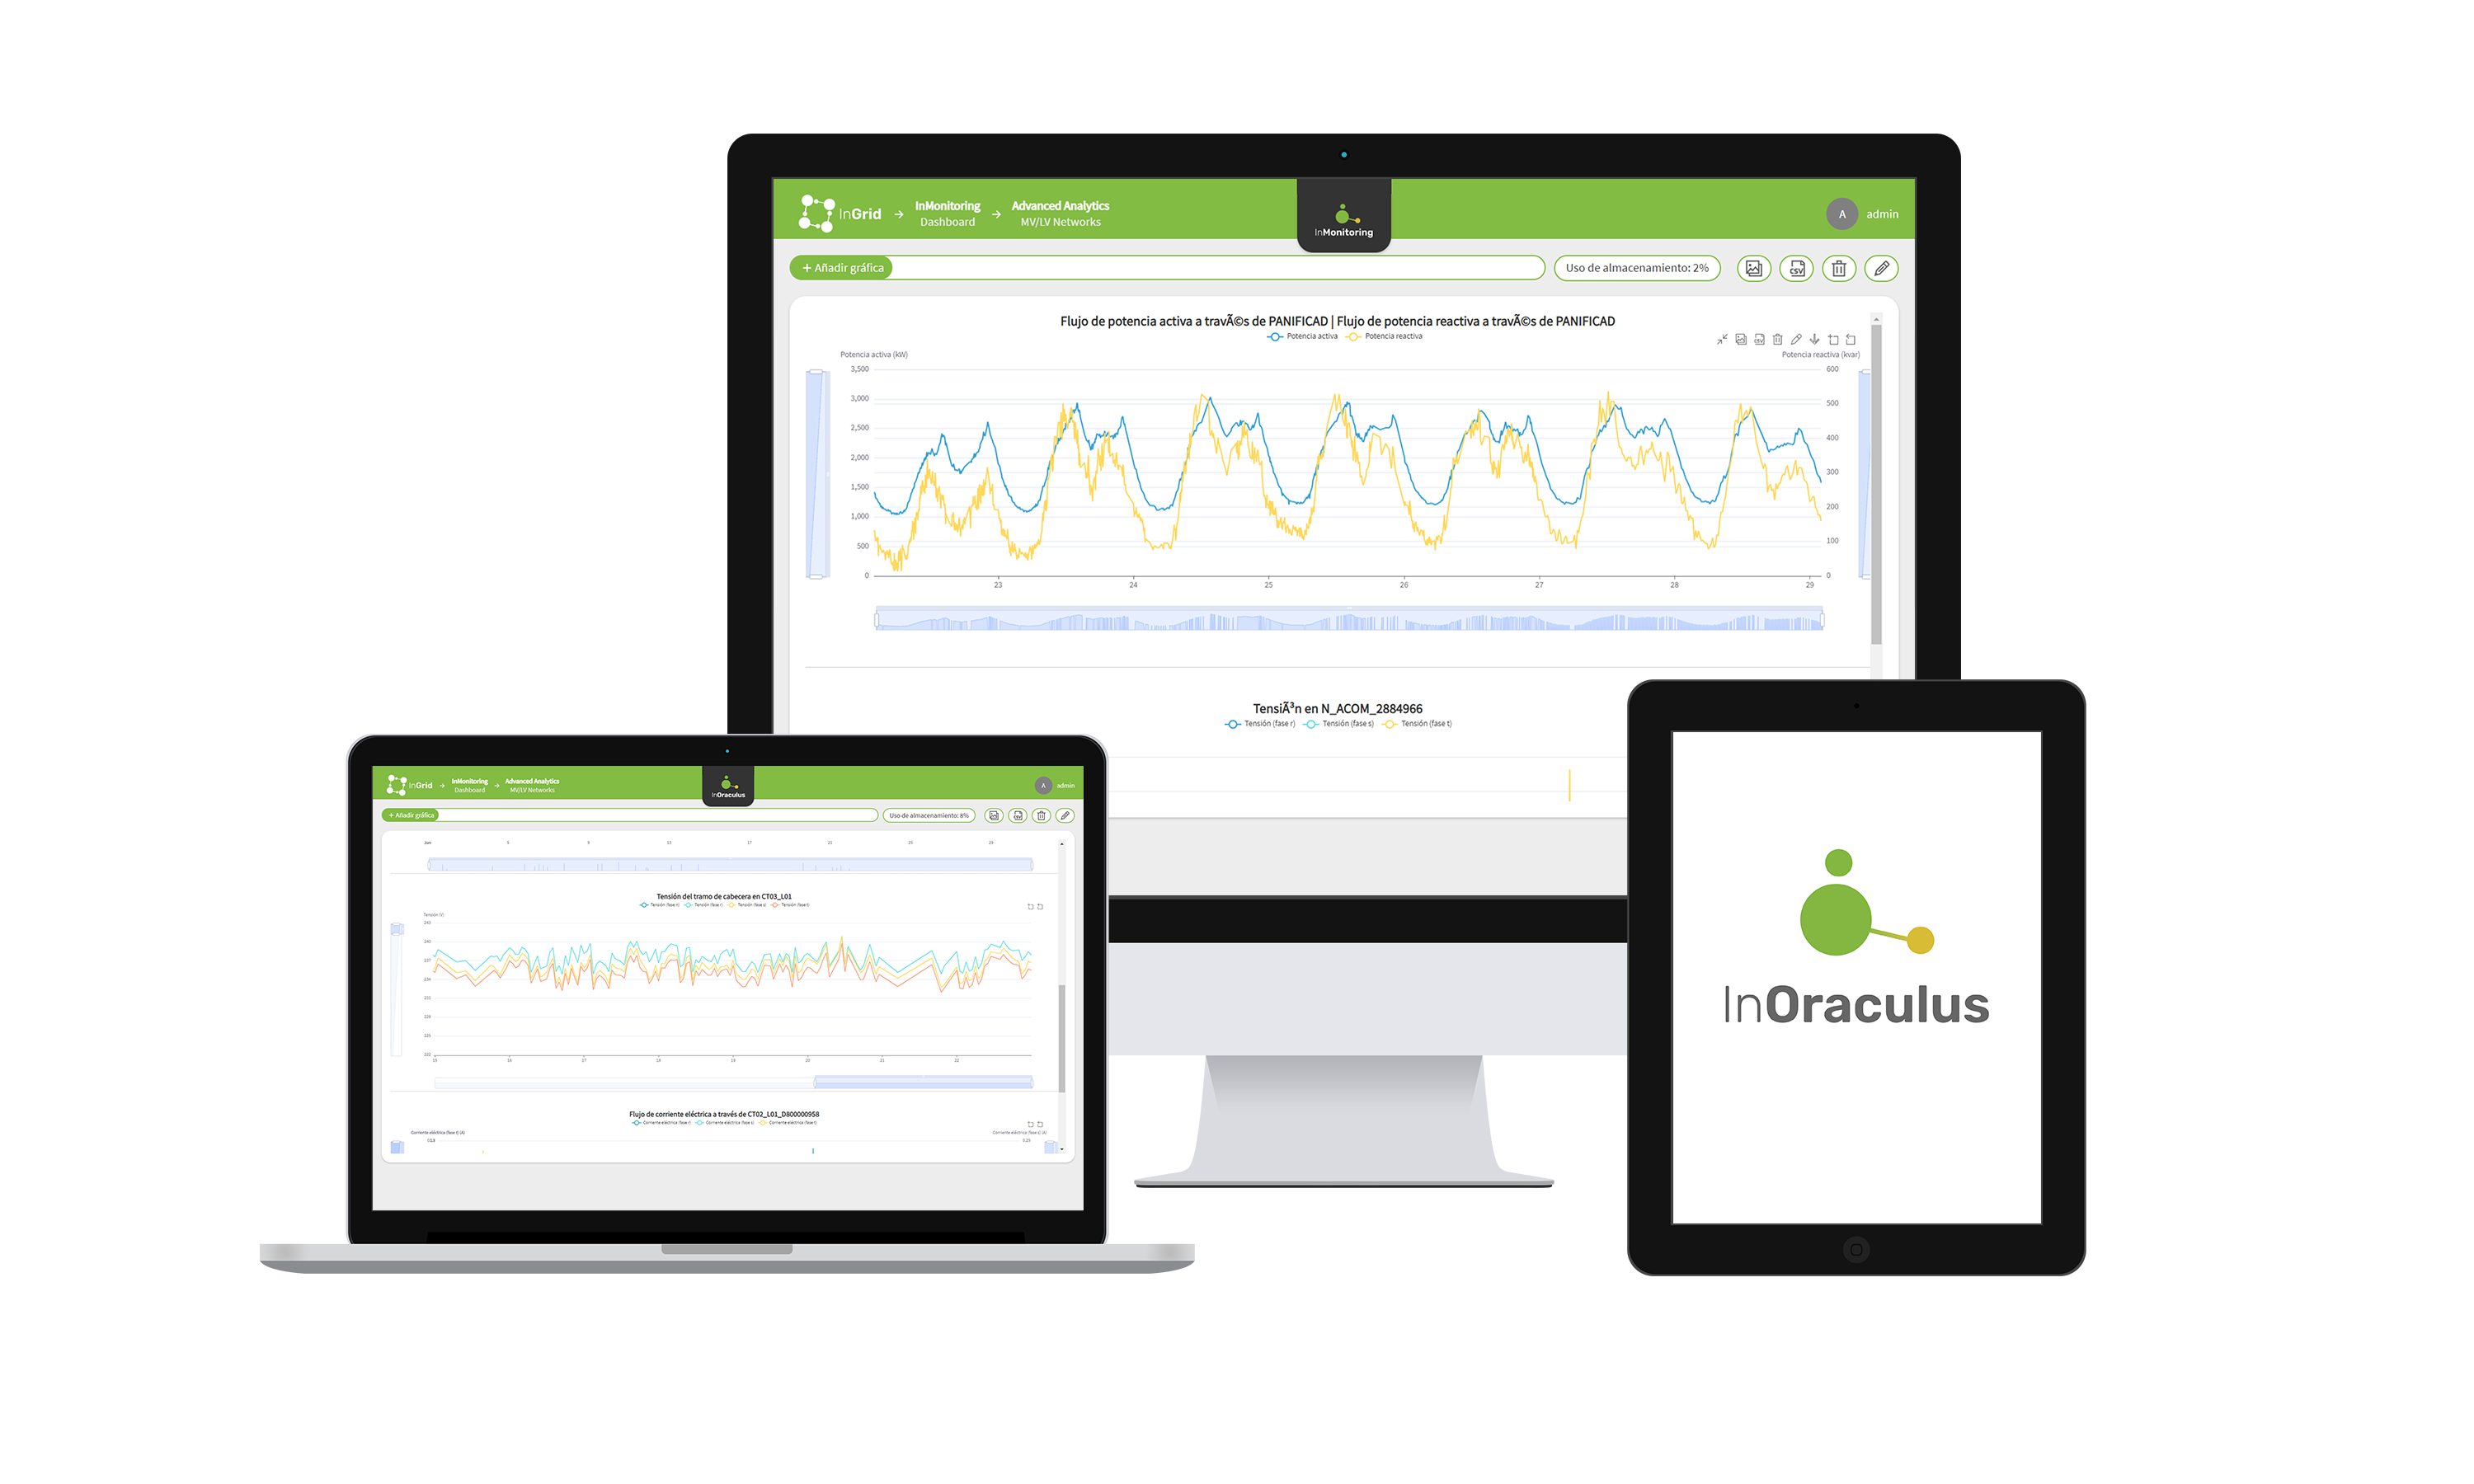
InOraculus is a demand and generation forecasting system both at the supply point level and at the aggregate level of low voltage feeder, transformer station or primary substation. The cutting-edge technology behind InOraculus uses Artificial Intelligence to train machine learning models and neural networks to generate short and medium-term future forecasts.
- It uses the information available from the DSO in the AMI and SCADAs.
- Generates energy and quarter-hourly power forecasts at the supply point level.
- Generates voltage, power and energy forecasts at the Secondary Substation level.
- Based on artificial intelligence, machine learning models, neural networks and data science.
- Deployment in any Cloud and Edge environment.
Use Cases:
- Network planning based on accurate forecasts of user demand and generation in the short and medium term.
- Filling of information gaps in hourly-load-curves and instantaneous values resulting from device communication problems.
- Preventive maintenance of electrical networks.
- Designing network operation strategies in advance

Manage your network in a smart way
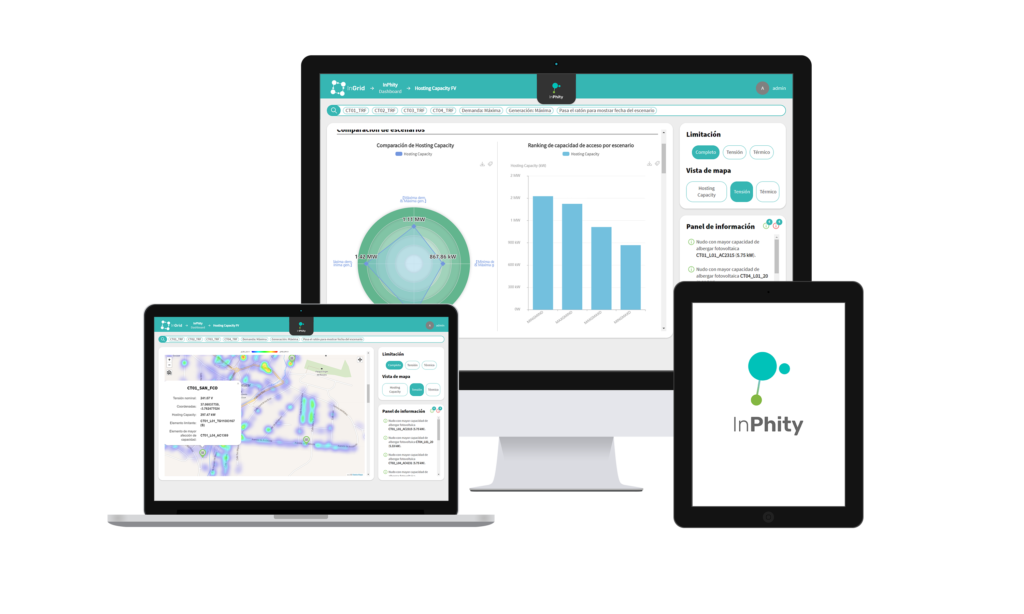
InPhity calculates the Hosting Capacity of Low Voltage and Medium Voltage grids based on Artificial Intelligence, allowing distributors to know the capacity to host new generation or demand in their entire network. Through an Optimal Power Flow methodology and a Digital Twin of the network, it is guaranteed that the Photovoltaic Hosting Capacity is calculated with the voltage limits per phase, according to the regulation, and with the thermal limits of the conductors, considering the three phases and the neutral individually.
- Based on precise network models.
- Applicable in Medium Voltage and Low Voltage models.
- It considers voltage and current limits.
- Fast convergence times: 0.5-4 seconds.
- Deployable in any Cloud and Edge environment.
Use Cases:
- Updating knowledge on how much photovoltaic, in the form of self-consumption or distributed generation, can be assumed by their networks without generating problem of quality or continuity of supply.
- Knowledge of the areas of its network that will present the greatest problems in a future horizon of growth of photovoltaic self-consumption with grid injection. Thus, to be able to orient your objectives of grid reinforcement or local flexibility markets.
- Plan new connections of photovoltaic or other loads, identifying the most appropriate LV feeders, connections and phases to connect them.

Manage your network
in a smart way
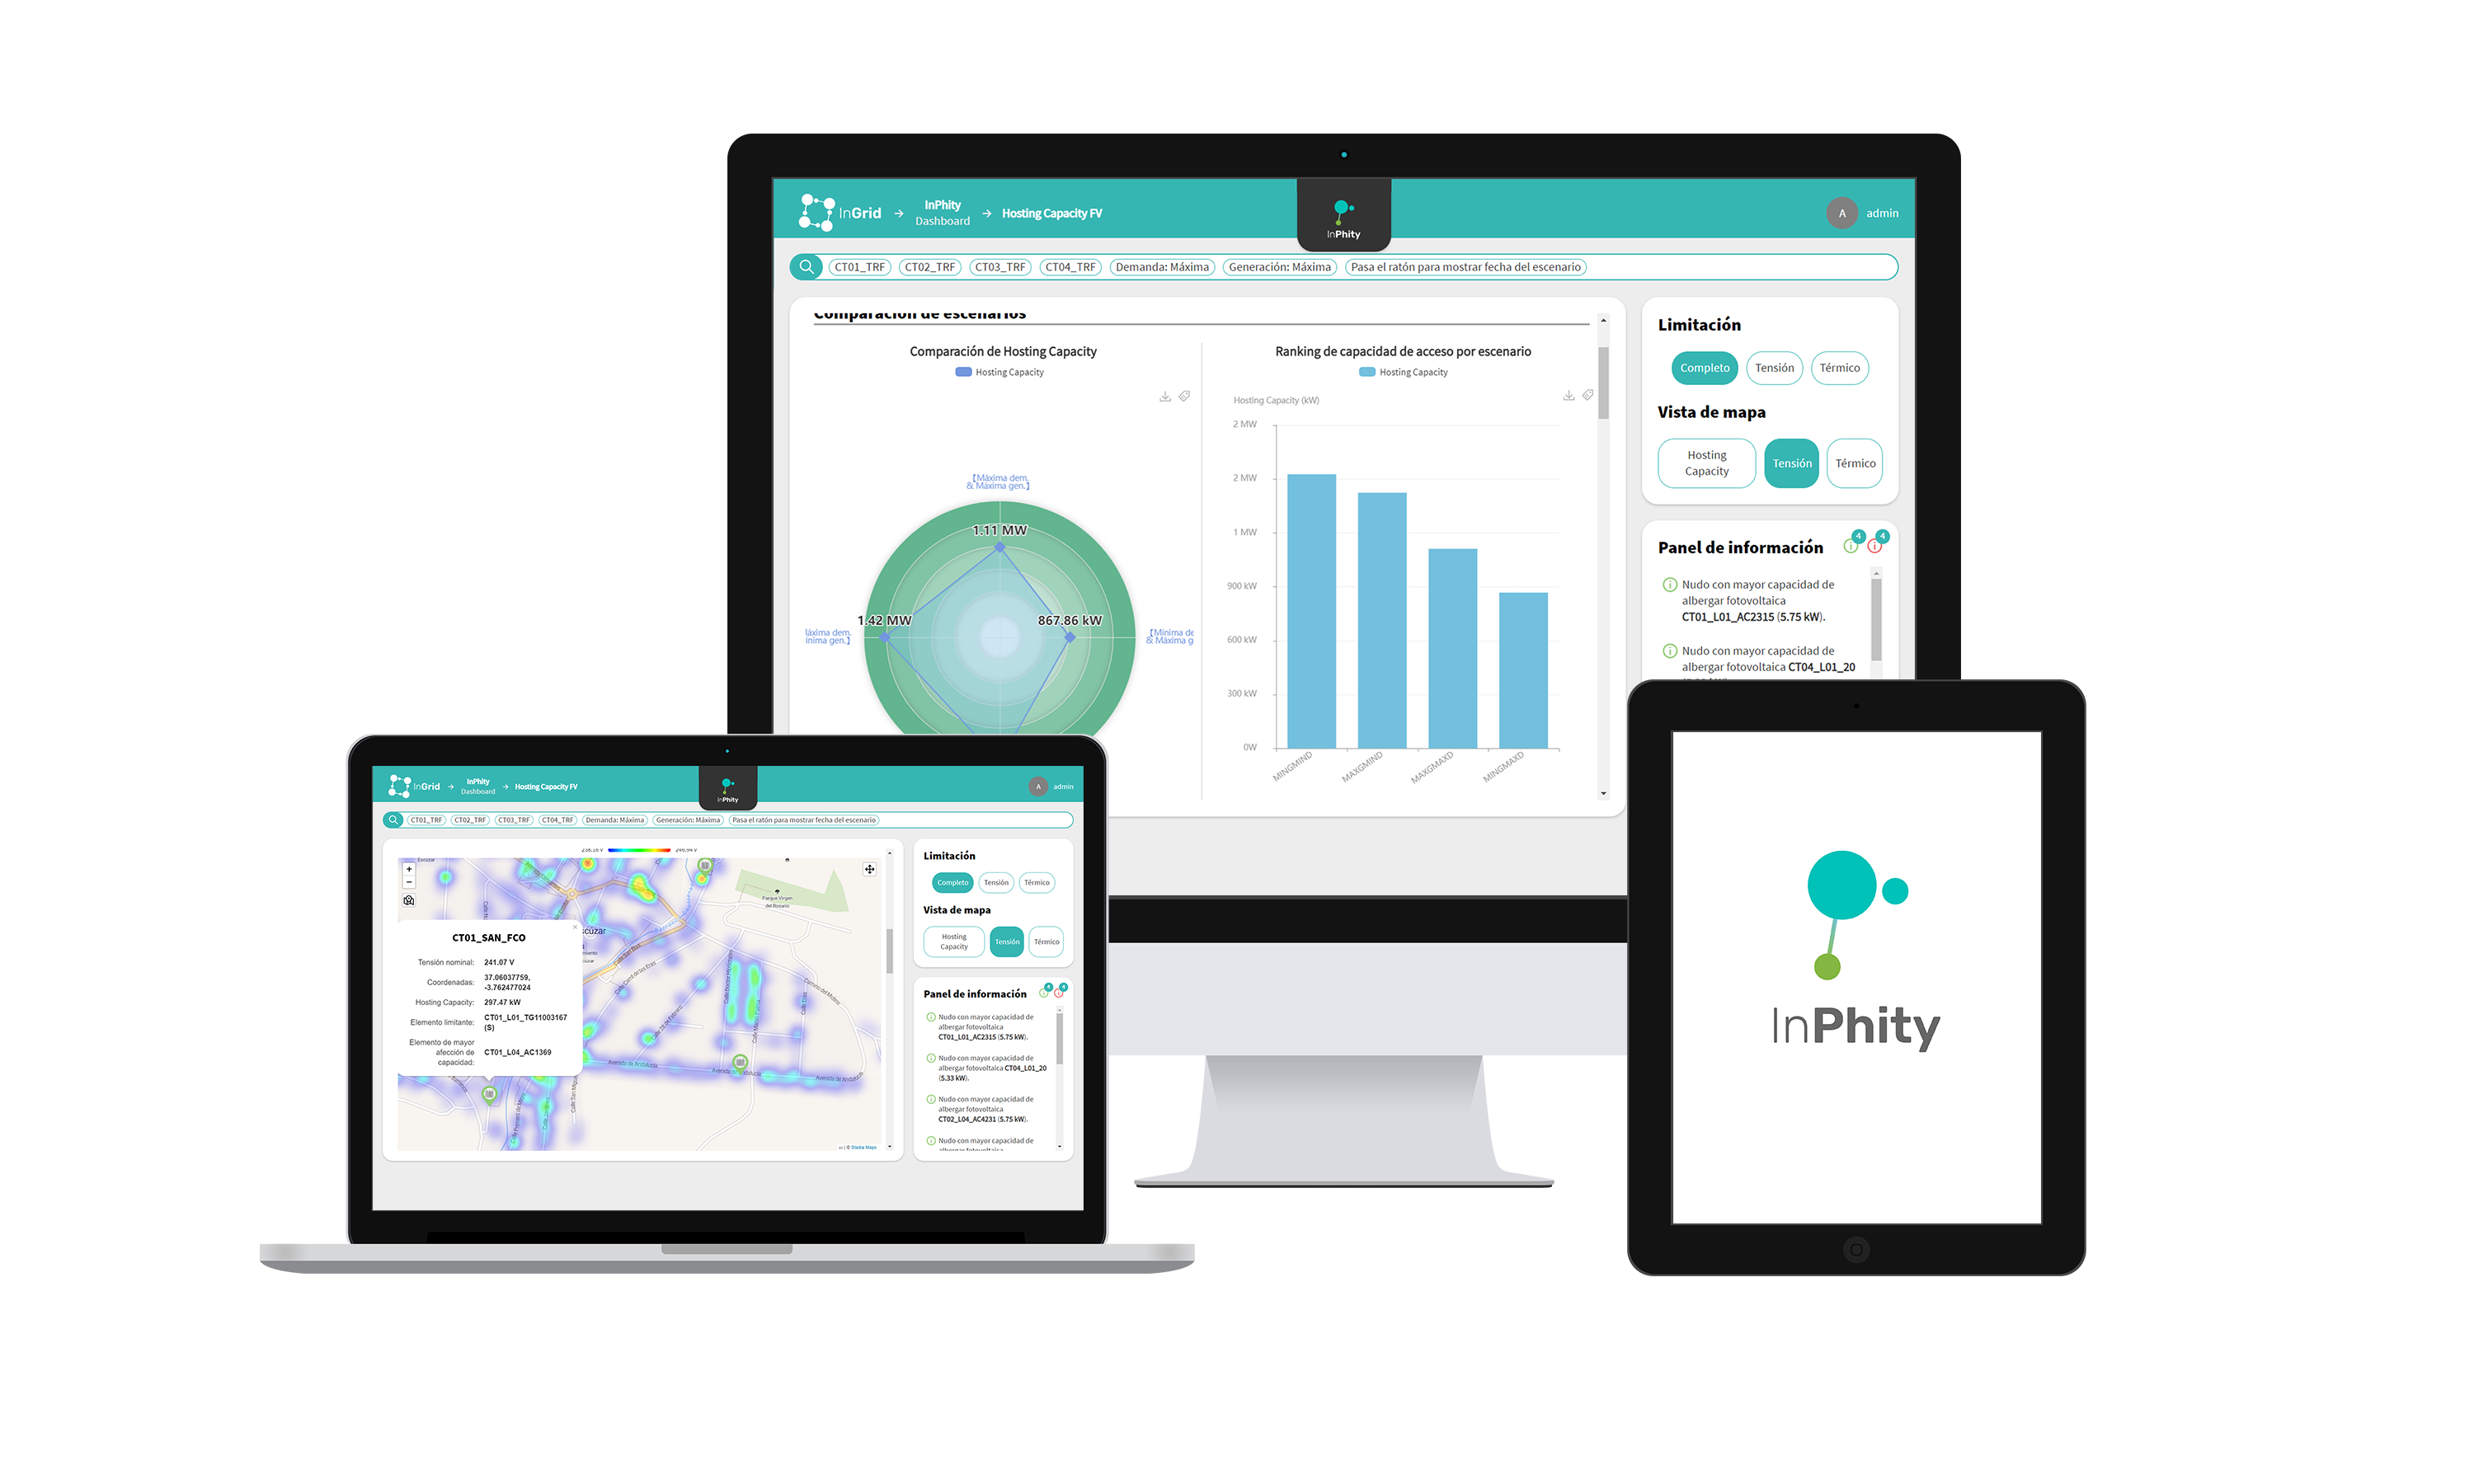
InPhity calculates the Hosting Capacity of Low Voltage and Medium Voltage grids based on Artificial Intelligence, allowing distributors to know the capacity to host new generation or demand in their entire network. Through an Optimal Power Flow methodology and a Digital Twin of the network, it is guaranteed that the Hosting Capacity is calculated with the voltage limits per phase, according to the regulation, and with the thermal limits of the conductors, considering the three phases and the neutral individually.
- Based on precise network models.
- Applicable in Medium Voltage and Low Voltage models.
- It considers voltage and current limits.
- Fast convergence times: 0.5-4 seconds.
- Deployable in any Cloud and Edge environment.
Use Cases:
- Updating knowledge on how much photovoltaic, in the form of self-consumption or distributed generation, can be assumed by their networks without generating problem of quality or continuity of supply.
- Knowledge of the areas of its network that will present the greatest problems in a future horizon of growth of photovoltaic self-consumption with grid injection. Thus, to be able to orient your objectives of grid reinforcement or local flexibility markets.
- Plan new connections of photovoltaic or other loads, identifying the most appropriate LV feeders, connections and phases to connect them.
INGRID PLATFORM FEATURES
INGRID PLATFORM FEATURES
Proprietary technology specialized
in electrical systems.

Network planning,
monitoring and optimization.

Interactive dashboards, historical and algorithm results.

Proprietary technology specialized
in electrical systems.

Network planning,
monitoring and optimization.

Interactive dashboards, historical and algorithm results.

Specialized technical support.

Integrable with third-party systems and platforms.

Deployable in Cloud and Edge environments.

Specialized technical support.

Integrable with third-party systems and platforms.

Deployable in Cloud and Edge environments.

REQUEST A DEMO
REQUEST A DEMO


